Why a compliance score should be three signals, not one number
A single compliance percentage hides the two things leadership most needs to know, how much of it rests on weak evidence and how much risk is still open. Here is how to report the three separately, and why it changes the conversation.
Azhar Ghafoor26 September 20266 min read
In short
A single compliance percentage blends three different questions and answers none of them well
Compliance says what was claimed, confidence says how well it is evidenced, risk health says what is still open
Missing mandatory evidence should cap a score, not quietly lower an average
Report the three side by side and never average them into one number
Every assessment eventually produces a number. Sixty two percent compliant. Seventy eight. The number goes into a board paper, the board asks whether it is good, and somebody says it is better than last year. Then everybody moves on.
The trouble is that one number is doing the work of three. It is trying to say how much of the framework you meet, how much you can actually prove, and how much danger is still sitting in the gaps. Those three things move independently, and when you average them together you get a figure that is precise, comfortable, and very nearly meaningless.
We learned this building assessment tooling for PISF. The fix is not a better formula. It is refusing to blend the signals at all.
The three questions hiding inside one number
When leadership asks how compliant the organisation is, they are really asking three different things.
The first is what have we claimed. Of the controls that apply to us, how many did we assess as met, partly met or not met. This is the compliance score most people already produce.
The second is how much of that can we prove. A control answered yes with a signed policy, a current configuration export and a reviewer's name behind it is not the same as a control answered yes with nothing attached. Both count the same in a plain compliance score. They should not count the same in anyone's confidence.
The third is what is still dangerous. A gap with a corrective plan, an owner and a date next month is a different thing from a gap nobody has picked up, or one whose plan is three months overdue. That is risk health, and it is the signal a board most needs and most rarely sees.
What goes wrong when you blend them
Imagine two organisations that both report seventy percent.
The first assessed honestly, attached evidence to almost every answer, and has a plan with an owner for each gap. The second answered generously, attached evidence to a handful of controls, and has a pile of gaps nobody has touched. A single percentage says these two are equally compliant. Anyone who has run an audit knows the second one is in trouble, and the number has just hidden that.
It gets worse over time. Because the blended score rewards answering yes, it quietly encourages answering yes. The organisation that wants a good number learns to be generous with its self assessment, and the number drifts away from reality without anyone deciding it should.
Show them side by side
The practical change is small. Report three figures, next to each other, and never combine them.
CyberNexus
Demo environment, sample dataAzbersInnovations
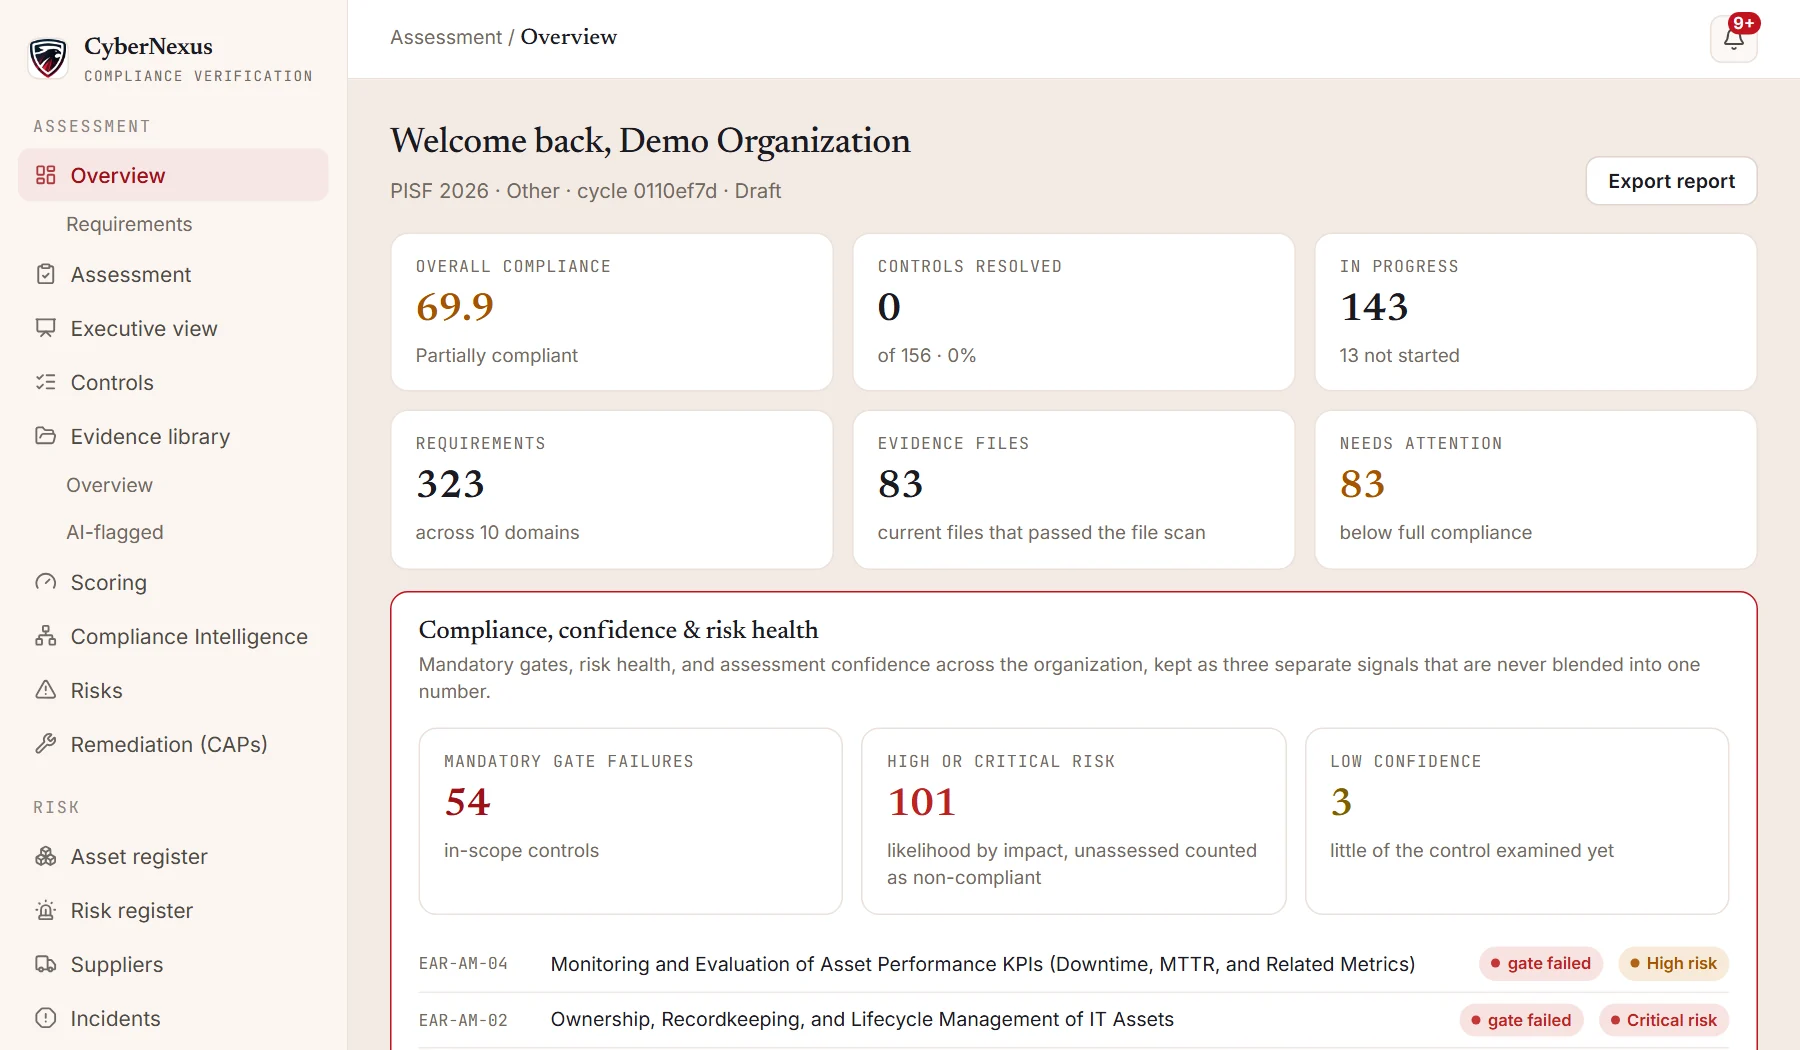
The CyberNexus overview keeps mandatory gate failures, controls at risk and low confidence controls as three separate counts, with the failing controls listed underneath. Sample data.
Once they sit side by side, the conversation changes. A board that sees high compliance, low confidence and poor risk health no longer hears good news. It hears a specific question about evidence and a specific question about who is working the gaps. Both are answerable, and both are far more useful than arguing about whether seventy is good.
Let missing evidence cap the score
Some controls in a national framework are not really negotiable. If the framework says a control must be evidenced with a particular kind of proof, then answering it as compliant without that proof should not earn full credit, however confident the person answering feels.
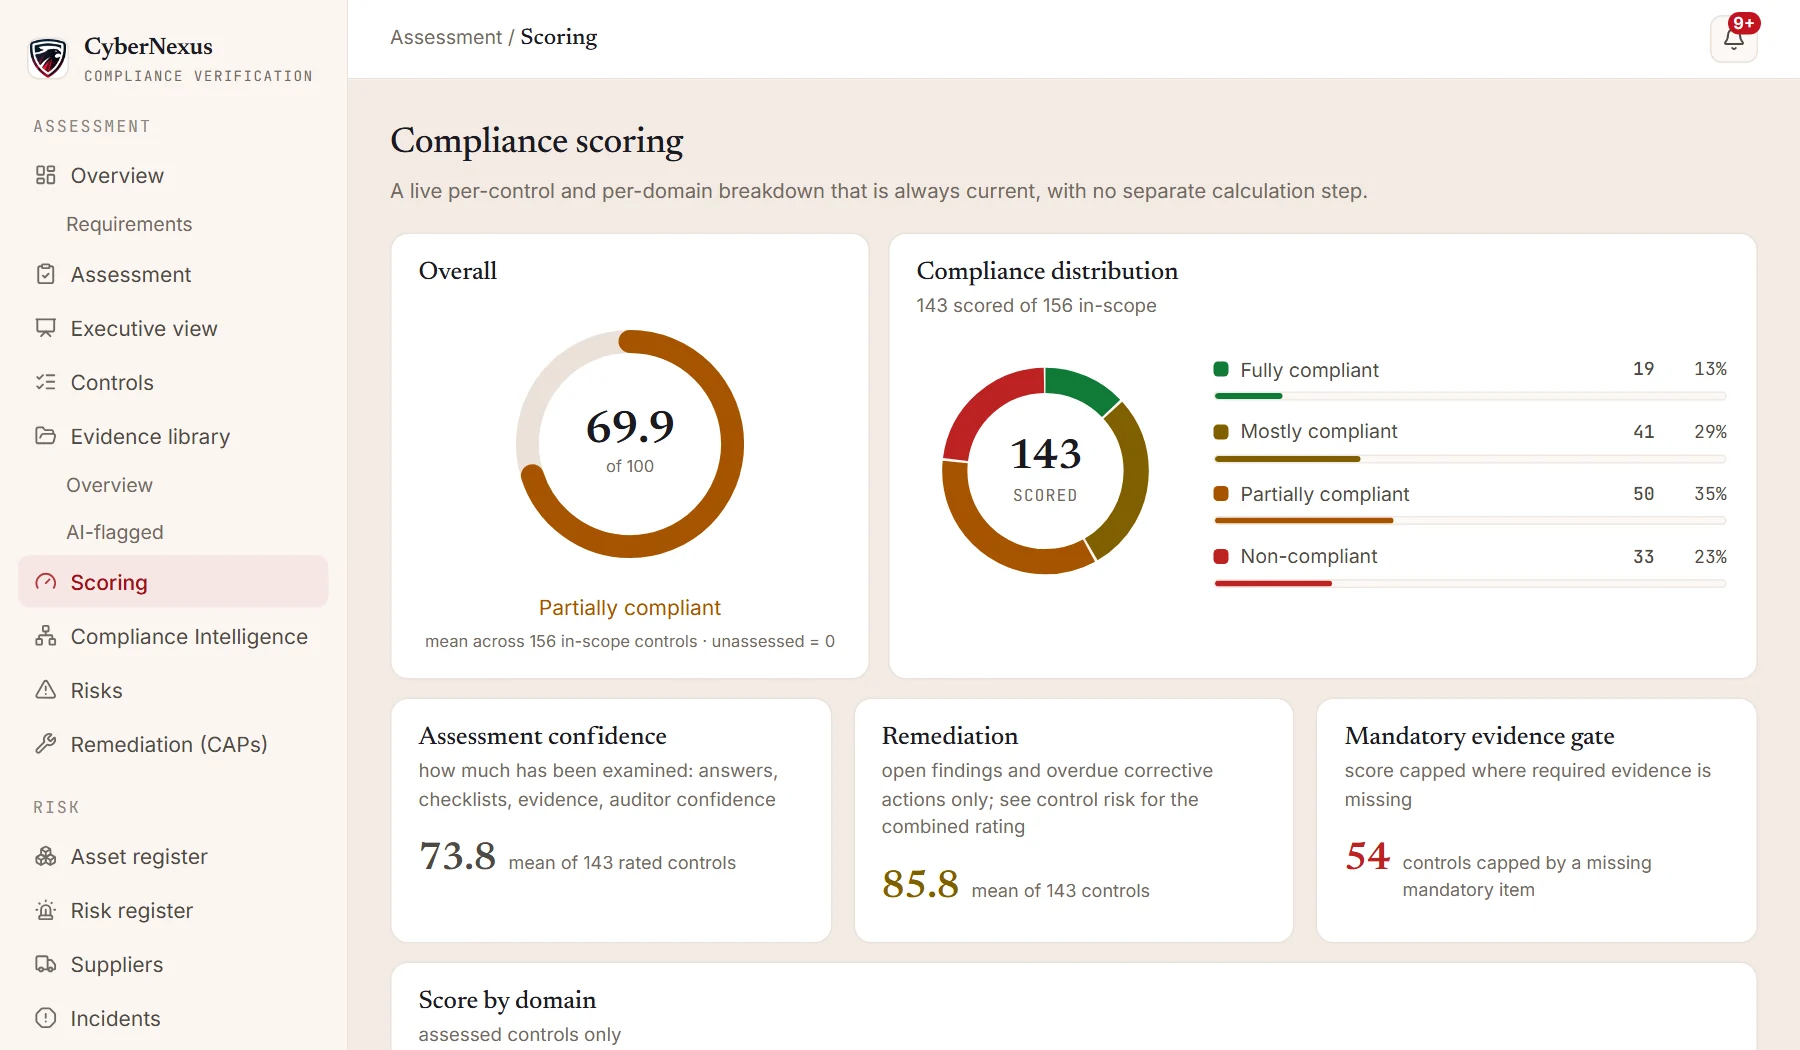
The cleanest way to handle this is a mandatory evidence gate. When required evidence is missing, the score for that control is capped until it arrives. That does two things. It stops a generous answer from inflating the total, and it produces a precise list of what to fix, rather than a vague sense that the number might be soft.
CyberNexus
Demo environment, sample dataAzbersInnovations
Compliance scoring in CyberNexus. The overall score sits beside the distribution of controls, assessment confidence, risk health and a count of controls capped by missing mandatory evidence, with a score for each PISF domain below. Sample data.
Calculate it, never type it
The last rule is the one that makes the other three trustworthy. A score should be calculated from the answers and the evidence, not entered by hand. If someone can type seventy into a cell, then seventy means whatever that person wanted it to mean on the day they typed it.
When the score is calculated from determinations, every figure can be traced back to the specific answers behind it. An auditor who doubts a domain score can open the domain and see which statements pulled it down. That traceability is what turns a number from a claim into evidence in its own right.
Try this on your next report
You do not need new software to start. On the next assessment report you send upward, do four things.
Split your single compliance figure into compliance, evidence confidence and risk health, and present them in one row.
For confidence, count the controls answered as met that have no current evidence attached, and show that count plainly.
For risk health, count open gaps with no owner, and gaps whose plan is past its date.
List the controls where mandatory evidence is missing, by name, rather than folding them into the percentage.
The first report in this shape usually looks worse than the one before it. That is the point. It is also the first one leadership can actually act on.
Common questions
What is assessment confidence
Assessment confidence is a measure of how well the answers in an assessment are supported. It rises with current, relevant evidence and reviewer agreement, and falls where answers have no evidence or evidence that is out of date. It is reported separately from the compliance score so that a well evidenced result and a generous one do not look the same.
What is risk health in a compliance assessment
Risk health describes how much of the risk behind the gaps is still open. It looks at whether each gap has a corrective action plan, an owner and a target date, and whether those plans are on time. A high compliance score with poor risk health usually means the gaps that remain are not being worked.
Why not average the three into one score
Because the average hides exactly the cases that matter. A high compliance score with weak evidence and a lower score with strong evidence can average to the same figure, while describing very different organisations. Keeping them separate is what makes each one useful.
What is a mandatory evidence gate
A rule that caps the score of a control when evidence the framework treats as required has not been provided. It prevents a compliant answer from earning full credit on assertion alone, and produces a clear list of what is missing.